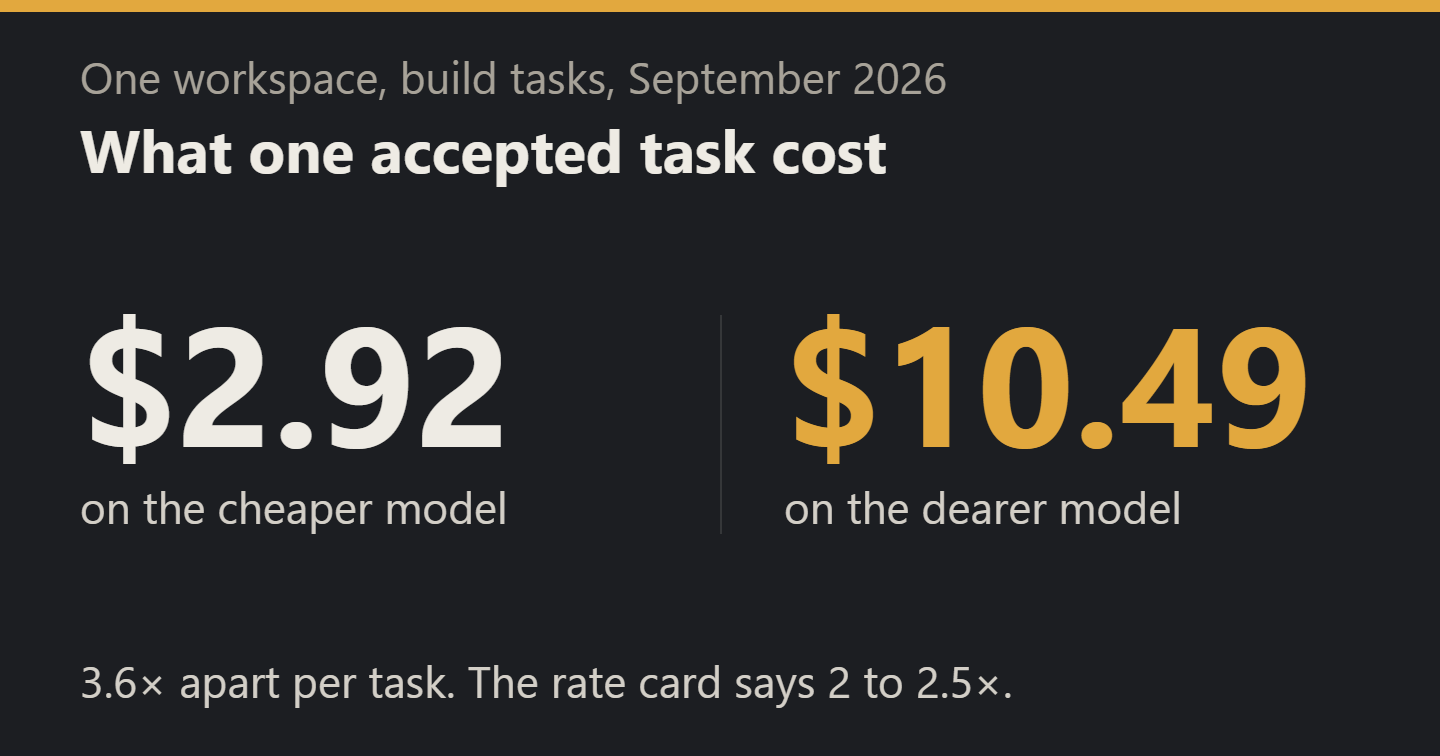
For a month I priced my coding agents by the task a reviewer accepted. It came to $2.92 a task on the cheaper model and $10.49 on the dearer one. The rate card puts those two models 2 to 2.5 times apart per token, and per accepted task they were 3.6 times apart.
In short. Price agent work by the accepted task, and keep the send-back rate beside it. In my September record most of the gap between two models came from how much work each task took, with the price list a distant second. The measure needs four fields in your task log, and two of mine were missing or wrong.
The unit is a task someone accepted
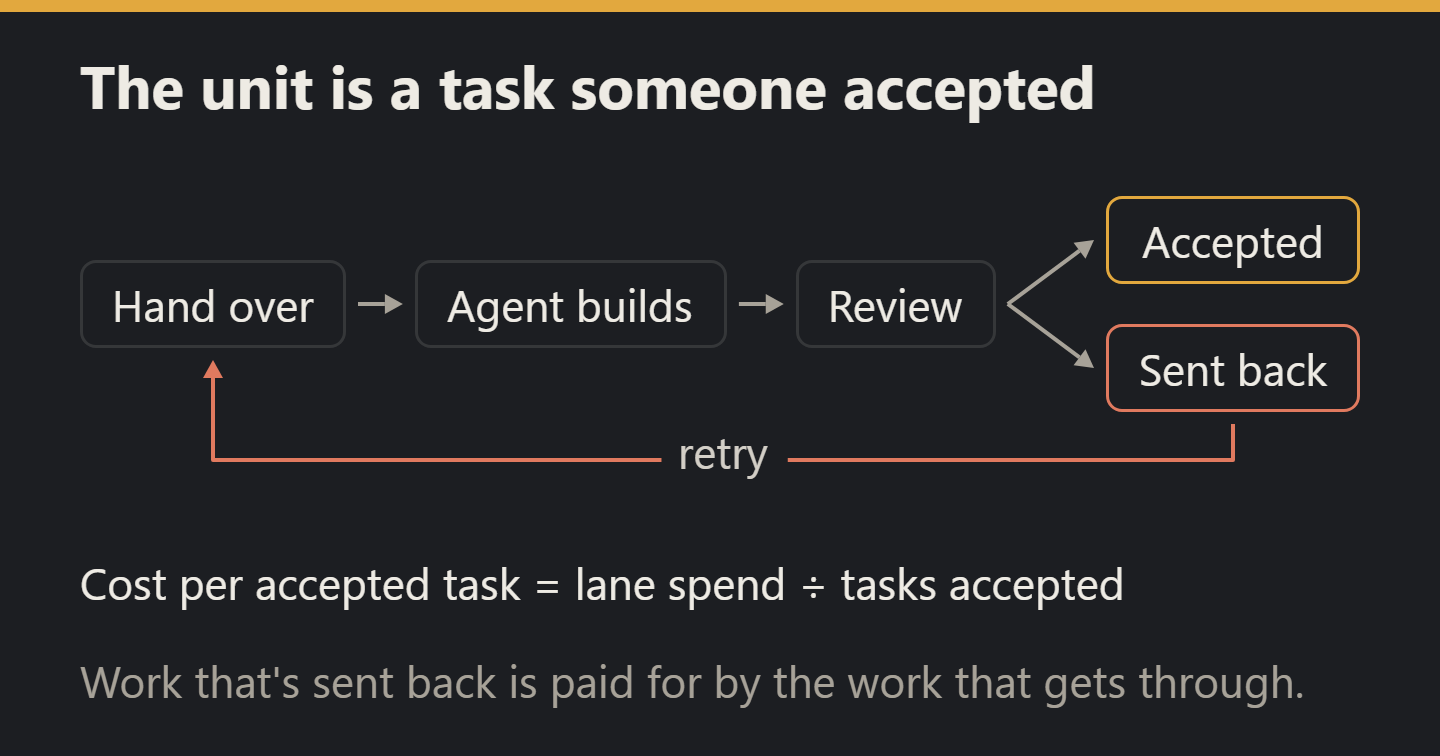
Every build task I hand to an agent gets a verdict when I review it. It's either accepted or sent back. Cost per accepted task is everything the lane spent divided by the tasks that were accepted, so the work that got sent back is paid for by the work that got through.
The record covers 31 August to 30 September in my own workspace. It holds 279 build tasks with a verdict, priced from their token counts at list rates. The cheaper model, Sonnet, ran 150 of them and the dearer one, Opus, ran 129.
What the month showed
Sonnet had 147 of its 150 tasks accepted for $428.87, which is $2.92 each. Opus had 116 of 129 accepted for $1,216.84, or $10.49 each. Three Sonnet tasks were sent back at review, which is 2.0%, against thirteen on Opus, 10.1%.
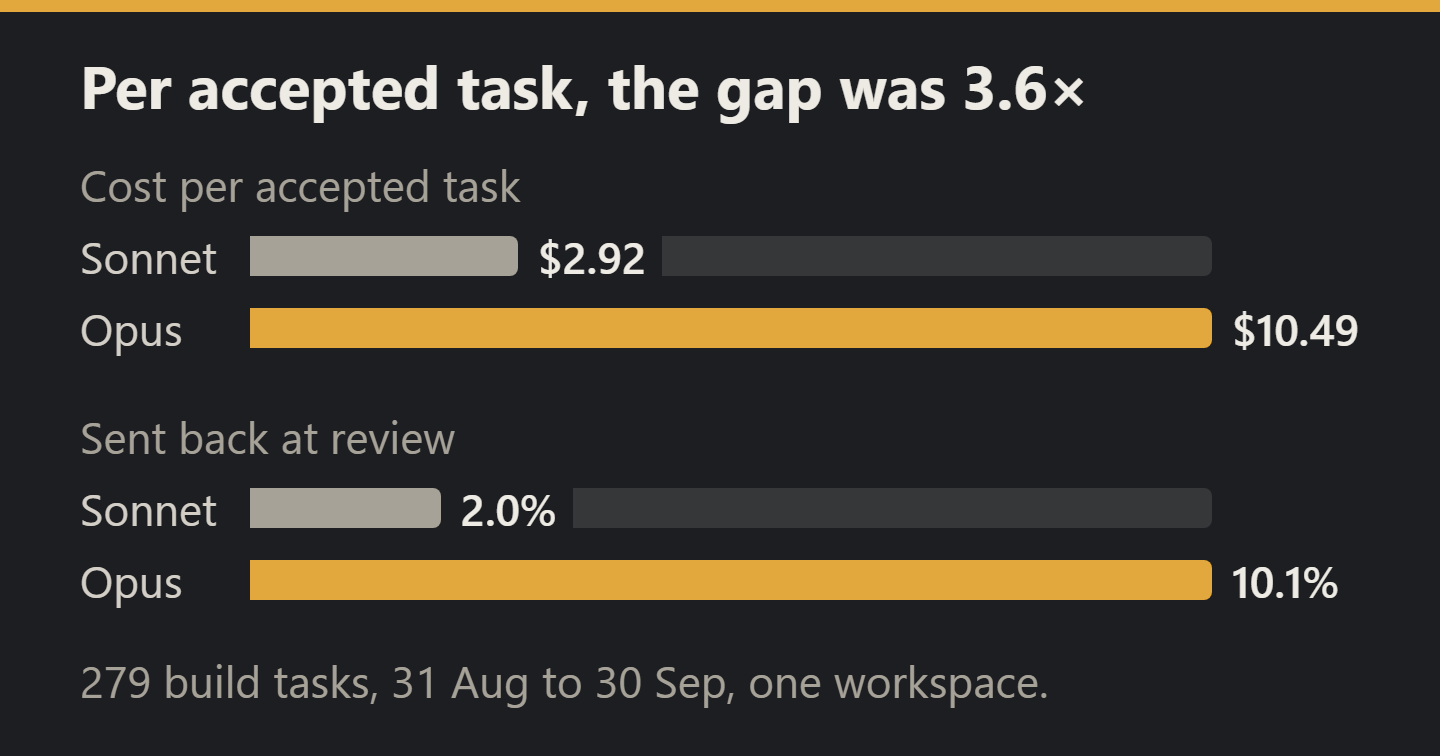
I wouldn't read that as the cheaper model being the better one. My routing sends the multi-file and long-running builds to Opus on purpose, so the two groups did different work. What the figures give me is what each lane costs per accepted task for the work I send it, and that's a number I can watch month on month.
Where the 3.6 comes from
The gap splits into three factors that multiply. On tokens actually paid for, cache discounts included, Opus cost 1.40 times as much per token. Its tasks used 2.35 times as many tokens. And it needed 1.09 times as many attempts per accepted task, because more of them came back.
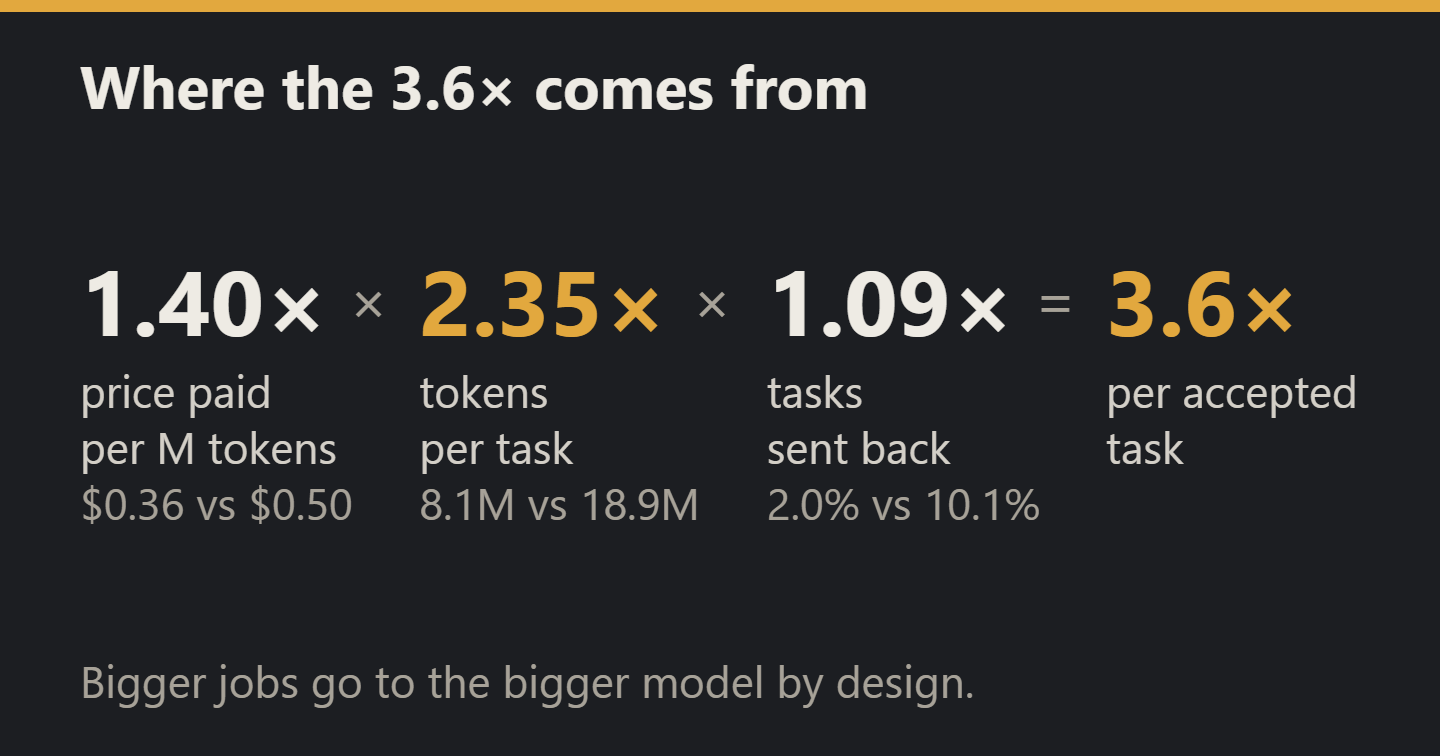
So the biggest factor was the size of the job, and the price list was a long way behind it. The average also hides a tail. Half the Sonnet tasks cost under $1.43 against a mean of $2.86, and the dearest tenth carried 45% of that group's spend.
What my own log got wrong
Taking the measurement found two holes in the log it was built on. The log recorded the model my routing table asked for, and 50 of 374 tasks had run on a different one, because the session handing out the work had overridden the table. A task that was sent back also couldn't be tied to its retry. Of 32 tasks sent back, 4 could be matched to the task that replaced them.
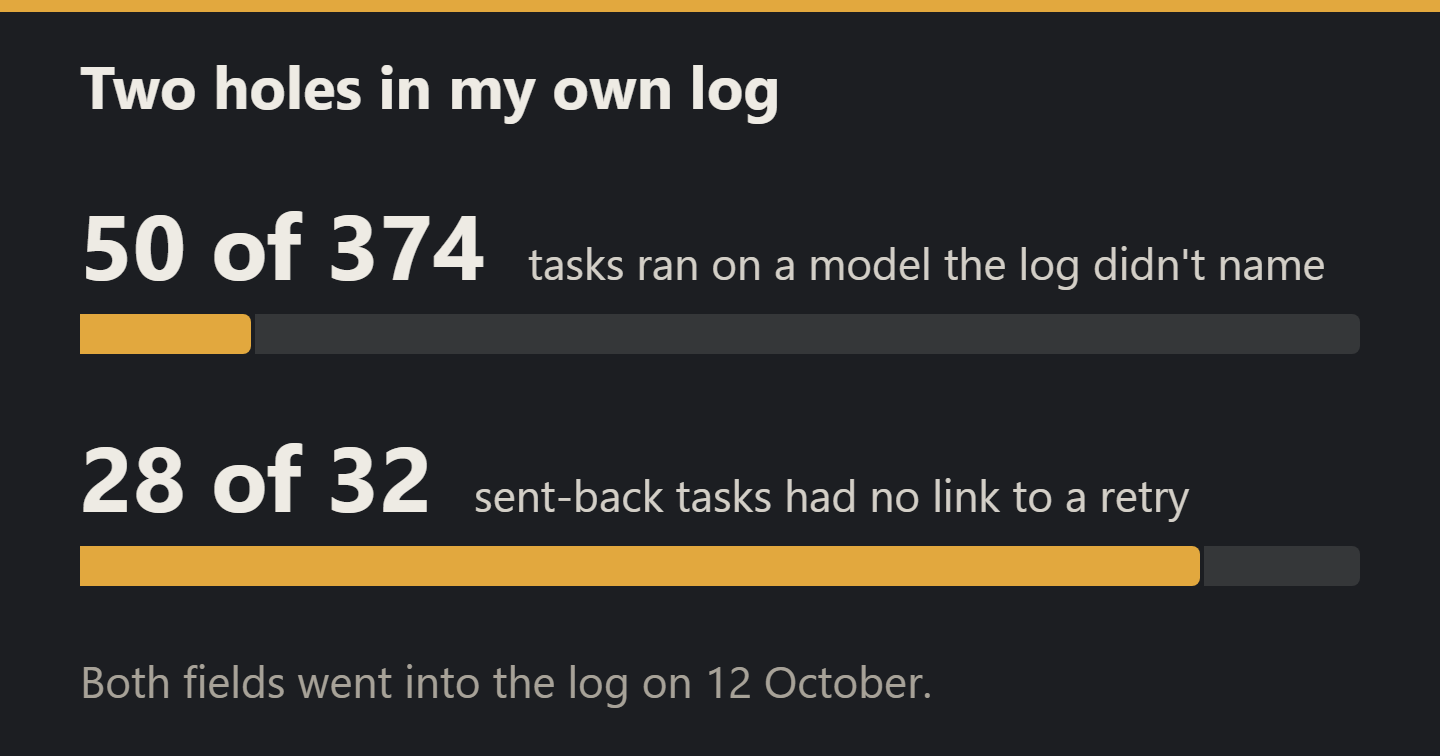
The second hole is why this piece prices an accepted task and stops short of a finished one. A finished task is the first attempt plus every retry until one is accepted, and I couldn't add those up. Both fields went into the log on 12 October.
Six weeks later
I read it again on 16 November over the trailing 30 days, with a rougher method that covers every lane and divides each model's spend by its accepted tasks. Sonnet came to $2.44 a task with 107 of 110 accepted. Opus came to $7.16 with 633 of 661. Send-backs were 2 and 18, so under 3% on both. The dollar gap held at about three times and the send-back gap mostly closed. The method differs enough that I'd compare the direction and leave the decimals alone.
What to copy
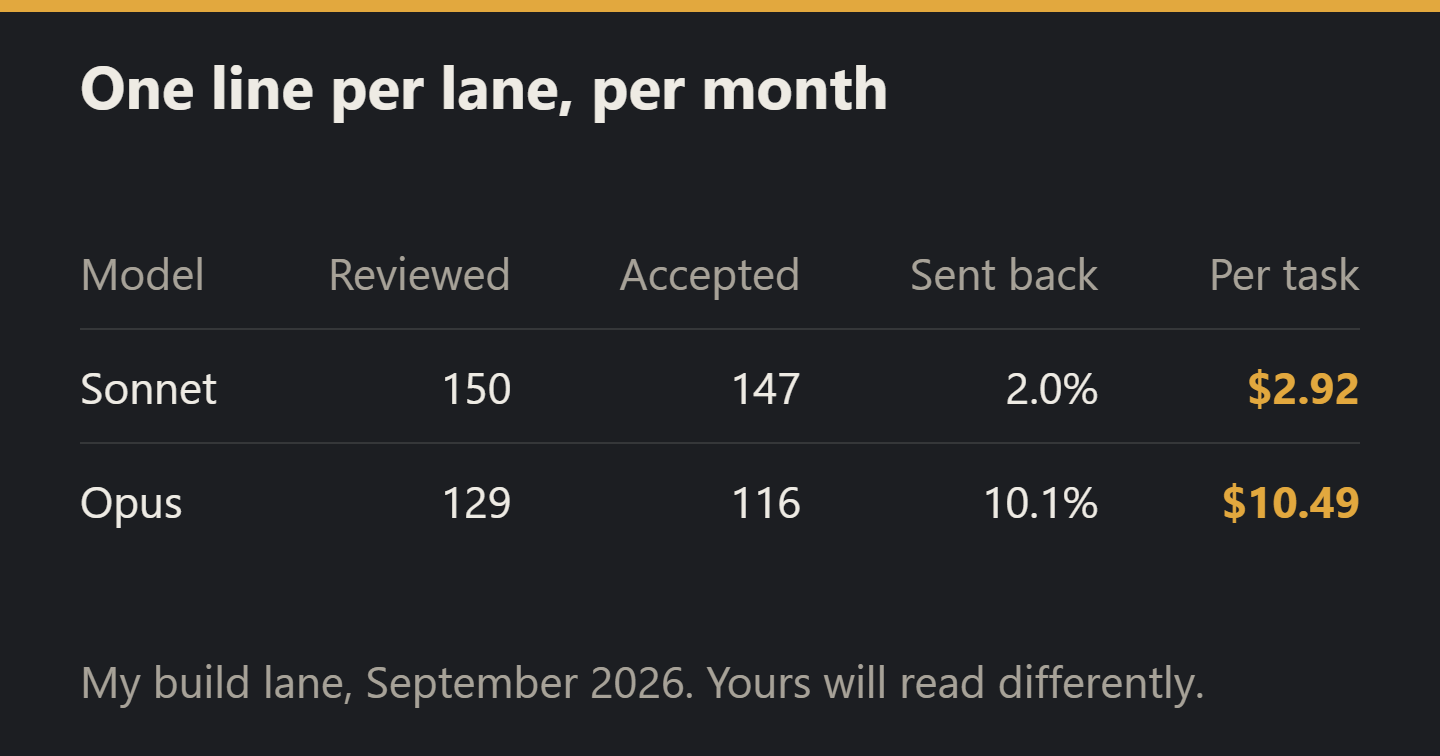
Four fields on every delegated task will get you this number. Record the lane, the model that ran it, the verdict at review, and a link from any retry to the task it replaces. Then keep one line per lane per month with the tasks reviewed, the tasks accepted, the share sent back and the cost per accepted task.
This is one workspace, one reviewer and a few hundred tasks, so your figures will differ. A spend cap would have stopped my bill, and it wouldn't have told me any of this. What does an accepted task cost on your team, and who could tell you?